📊 收集回复和指标#
反馈数据集#
注意
本节中介绍的数据集类是 FeedbackDataset。这个完全可配置的数据集将在 Argilla 2.0 中取代 DatasetForTextClassification、DatasetForTokenClassification 和 DatasetForText2Text。不确定使用哪个数据集?请查看我们关于选择数据集的部分。
要通过 Python 收集注释者给出的回复,您可以简单地从 Argilla 加载数据集,如下所示
import argilla as rg

rg.init(
    api_url="...",
    api_key="...",
)

feedback = rg.FeedbackDataset.from_argilla("demo_feedback", workspace="recognai")
feedback.records 中的每个记录都将具有一个 responses 属性,您将在其中找到包含该记录的所有回复的列表(如果有)。每个回复将具有以下属性
user_id:包含注释者的 Argilla 用户 IDvalues:包含注释者给出的回复,以字典的形式,其中键是问题的名称,值是另一个字典,您可以在其中找到键value下的问题答案。status:包含回复的状态,即它是submitted还是discarded。
如果您的数据集没有任何注释重叠,即所有记录最多只有一个回复,则后处理阶段将非常简单,因为您无需决定保留哪些注释以及丢弃哪些注释。
注意
请记住仅考虑状态为 submitted 的回复。
衡量分歧#
如果您的数据集确实有记录包含多个 submitted 回复,您将需要在训练数据之前统一回复。
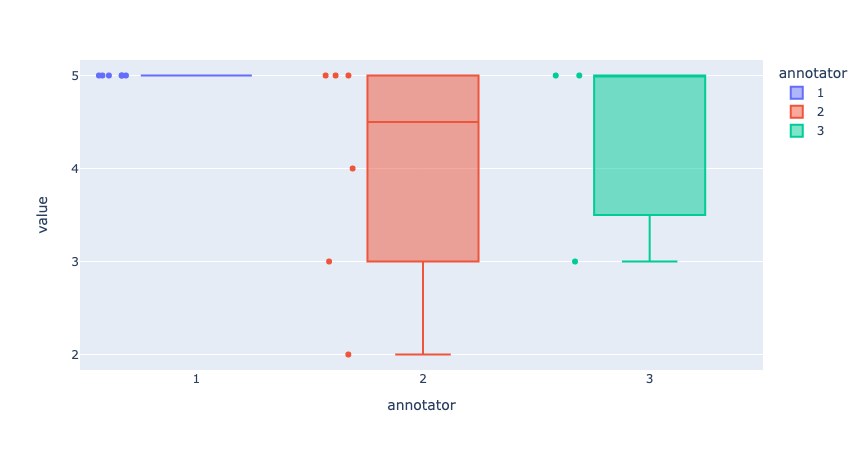
评分通常代表主观价值,这意味着这些问题没有对错之分。但是,由于 RatingQuestion 具有封闭的选项集,因此它们的结果可以帮助可视化注释者之间的分歧。另一方面,文本是独特且主观的,使得两个注释者几乎不可能为 TextQuestion 给出相同的答案。因此,我们不建议使用这些回复来衡量分歧。
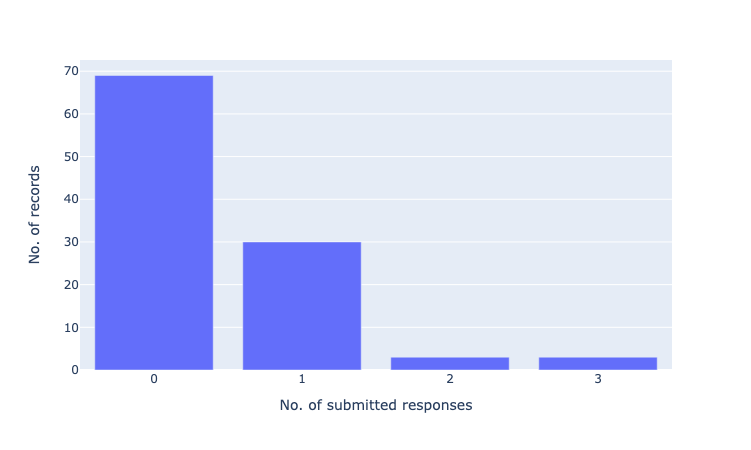
如果您想对回复进行初步探索,可以使用您首选的库来绘制数据。以下是一些简单的可视化示例,您可以执行这些可视化来评估注释者之间潜在的分歧
# plot 1: submitted responses per record
from collections import Counter, OrderedDict
import plotly.express as px

count_submitted = Counter()
for record in feedback.records:
    if record.responses:
        submitted = [r for r in record.responses if r.status == "submitted"]
        count_submitted[len(submitted)] += 1
count_submitted = OrderedDict(sorted(count_submitted.items()))
count_submitted = [{"submitted_responses": k, "no_records": v} for k, v in count_submitted.items()]

fig = px.bar(count_submitted, x="submitted_responses", y="no_records")
fig.update_xaxes(title_text="No. of submitted responses", dtick=1)
fig.update_yaxes(title_text="No. of records")
fig.show()
# plot 2: distance between responses in rating question
list_values = []
for record_ix,record in enumerate(feedback):
    if record.responses:
        submitted = [r for r in record.responses if r.status == "submitted"]
        if len(submitted) > 1:
            for response_ix, response in enumerate(submitted):
                list_values.append({"record": str(record_ix+1), "annotator": str(response_ix+1), "value": response.values["rating"].value})


fig = px.box(list_values, x="annotator", y="value", color="annotator", points="all", hover_data="record")
fig.update_yaxes(dtick=1)
fig.show()
提示
如果您觉得注释者之间的分歧太高,特别是对于那些不那么主观的问题,这是一个很好的迹象,表明您应该审查您的注释指南和/或问题和选项。
统一分歧#
在本节中,我们将探讨一些可用于解决回复中分歧的技术。这些并非唯一可能的技术,您应该根据您的项目和注释团队的需求仔细选择它们。即使有很多方法可以统一回复,我们仍为其中一些方法提供开箱即用的支持。
代码#
您可以通过结合使用 FeedbackDataset 和 QuestionStrategy 来统一回复。
from argilla import LabelQuestionStrategy, FeedbackDataset

dataset = FeedbackDataset.from_huggingface(
    repo_id="argilla/stackoverflow_feedback_demo"
)
strategy = LabelQuestionStrategy("majority") # "disagreement", "majority_weighted (WIP)"
dataset.compute_unified_responses(
    question=dataset.question_by_name("title_question_fit"),
    strategy=strategy,
)
dataset.records[0].unified_responses
from argilla import MultiLabelQuestionStrategy, FeedbackDataset

dataset = FeedbackDataset.from_huggingface(
    repo_id="argilla/stackoverflow_feedback_demo"
)
strategy = MultiLabelQuestionStrategy("majority") # "disagreement", "majority_weighted (WIP)"
dataset.compute_unified_responses(
    question=dataset.question_by_name("tags"),
    strategy=strategy,
)
dataset.records[0].unified_responses
from argilla import RankingQuestionStrategy, FeedbackDataset

dataset = FeedbackDataset.from_huggingface(
    repo_id="argilla/stackoverflow_feedback_demo"
)
strategy = RankingQuestionStrategy("majority") # "mean", "max", "min"
dataset.compute_unified_responses(
    question=dataset.question_by_name("relevance_ranking"),
    strategy=strategy,
)
dataset.records[0].unified_responses
from argilla import RatingQuestionStrategy, FeedbackDataset

dataset = FeedbackDataset.from_huggingface(
    repo_id="argilla/stackoverflow_feedback_demo"
)
strategy = RatingQuestionStrategy("majority") # "mean", "max", "min"
dataset.compute_unified_responses(
    question=dataset.question_by_name("answer_quality"),
    strategy=strategy,
)
dataset.records[0].unified_responses
注意
您还可以直接传递 question 和 strategy 作为字符串。
警告
从 Argilla 1.21.0 开始,unify_responses 已被弃用。请改用 compute_unified_responses。
策略#
对于标签:LabelQuestion 和 MultiLabelQuestion#
多数票(单标签问题):可以使用最受欢迎的选项聚合标签,为此您至少需要 3 个提交的回复。如果出现平局,您可以通过选择一个随机选项来打破平局。
多数票(多标签问题):如果您要聚合来自多标签问题的标签,则更正确的方法是计算每个标签的多数票。这意味着对于每个标签,您需要检查大多数注释者是否选择了该特定标签。
加权多数票:您可能会决定在聚合标签时给某些注释者比其他注释者更高的权重,以便他们的决定比其他注释者更重要。考虑加权多数的一些原因可能是:因为某些注释者倾向于与地面实况注释具有更好的一致性,他们是专家,或者他们代表特定问题的人口目标。如果您想选择此选项,请首先计算每个注释者的 0 到 1 的分数,然后将这些权重应用于他们的回复。最后,将所有值相加并选择得分最高的选项。
使用分歧进行训练:如果您的标签旨在解决高度主观的任务,例如情感分析或辱骂性语言检测,您可能需要考虑其他选项,这些选项可以在训练期间保留注释者之间的自然分歧。这对于避免稀释注释团队中少数群体的反馈尤其有帮助。如果您想了解有关此方法的更多信息,我们建议查看 Davani 等人(2021 年) 中讨论的不同方法。
对于数值:RankingQuestion 和 RatingQuestion#
多数票:如果记录有超过 2 个提交的回复,您可以将最受欢迎的值(对于
RankingQuestion,最受欢迎的排名,对于RatingQuestion,最受欢迎的评分)作为最终分数。如果出现平局,您可以通过选择随机选项或最低/最高分来打破平局。加权多数票:如上文所述,您可能希望权衡不同注释者的回复。在这种情况下,计算每个注释者的 0 到 1 的分数,然后将这些权重应用于他们的回复。最后,将所有值相加并选择得分最高的选项。
平均分:对于此技术,您可以获取所有回复并计算平均分。
最低/最高分:根据问题的措辞方式,您可以取
max或min值。
对于文本:TextQuestion#
对回复进行评分/排名:创建一个新数据集,其中包含您在记录字段中收集的文本,并要求您的注释团队对回复进行评分或排名。然后选择得分最高的回复。如果出现平局,请随机选择一个选项,或者考虑复制记录,如下所述。
根据注释者选择:获取记录的子集(足以很好地表示每个注释者的回复),并如上一节所述对其进行评分/排名。然后,根据团队的偏好,为每个注释者打分。您可以使用此分数在整个数据集中选择文本回复。
根据对其他问题的回答选择:您可以使用对其他问题的回答作为质量标记。例如,您可以假设给出最低分数的人会进行更广泛的更正,您可能希望选择该文本作为最终文本。但是,此方法不能保证文本的质量。
复制记录:您可能会认为您的注释团队给出的不同答案都是有效的选项。在这种情况下,您可以复制记录以保留每个答案。同样,此方法不能保证文本的质量,因此建议检查文本的质量,例如使用评分问题。
注释指标#
有多种方法可以分析数据集上的注释。在本节中,我们将介绍三种不同的方法,这些方法将使我们能够分析注释者之间的一致性、分析回复相对于建议作为基本事实的质量,以及分析建议相对于回复作为基本事实的质量。
注意
以下指标仅适用于 FeedbackDataset。
一致性指标#
在注释过程之后,应评估注释数据以查看获得的結果的质量。评估的第一步是计算注释者之间的一致性。注释者间一致性 (IAA)(在文献中通常被称为)是一种探索许多参数的性能的方法,例如注释指南的质量、注释过程中是否存在统一性以及注释者在其注释中是否一致。
import argilla as rg
from argilla.client.feedback.metrics import AgreementMetric

feedback_dataset = rg.FeedbackDataset.from_argilla("...", workspace="...")
metric = AgreementMetric(dataset=feedback_dataset, field_name="text", question_name="question_name")
agreement_metrics = metric.compute("alpha")
# >>> agreement_metrics
# [AgreementMetricResult(metric_name='alpha', count=1000, result=0.467889)]
通过 compute 函数,我们获得了一个容器,该容器存储指标名称和指标值,以及用于计算指标的记录数。
也可以从 FeedbackDataset 轻松计算指标
import argilla as rg

#dataset = rg.FeedbackDataset.from_huggingface("argilla/go_emotions_raw")

agreement_metrics = dataset.compute_agreement_metrics(question_name="label", field_name="text", metric_names="alpha")
agreement_metrics

# AgreementMetricResult(metric_name='alpha', count=191792, result=0.2703263452657748)
目前,唯一支持的一致性指标是 Krippendorf's alpha,适用于除 TextQuestion 之外的所有问题类型。此指标可以为任意数量的注释者计算,即使某些回复未提交也是如此。此度量的取值范围为 [0,1],通常按以下方式解释:alpha >= 0.8 表示可靠的注释,alpha >= 0.667 允许做出初步结论,而较低的值表示不可靠的注释。
注意
如果您想更深入地研究不同注释者之间一致性的度量,请查看 Artstein 和 Poesio (2007) 调查的注释者间一致性系数的实现,计算语言学的注释者间一致性。
支持的一致性指标#
我们计划添加对其他指标的更多支持,因此请随时在我们的 Slack 或 GitHub 上联系我们,以帮助我们确定每个任务的优先级。
问题类型/指标 |
alpha |
|---|---|
LabelQuestion |
✔️ |
MultiLabelQuestion |
✔️ |
RatingQuestion |
✔️ |
RankingQuestion |
✔️ |
TextQuestion |
模型指标#
与一致性指标(我们比较注释者之间的回复)相比,评估模型建议与注释者(作为基本事实)是一个很好的做法。由于 FeedbackDataset 已经提供了向回复添加 suggestions 的可能性,我们可以将这些初始预测与已验证的回复进行比较。这将为我们提供两个重要的见解:给定注释者的回复有多可靠,以及我们向注释者提供的建议有多好。这样,我们可以通过更改指南或结构来采取措施来提高回复的质量,并通过更改或更新我们使用的模型来改进提供给注释者的建议。请注意,每种问题类型都有一组不同的可用指标。
以下是使用 compute 函数计算 FeedbackDataset 指标的示例用法
import argilla as rg
from argilla.client.feedback.metrics import ModelMetric

feedback_dataset = rg.FeedbackDataset.from_argilla("...", workspace="...")
metric = ModelMetric(dataset=feedback_dataset, question_name="question_name")
annotator_metrics = metric.compute("accuracy")
# >>> annotator_metrics
# {'00000000-0000-0000-0000-000000000001': [ModelMetricResult(metric_name='accuracy', count=3, result=0.5)], '00000000-0000-0000-0000-000000000002': [ModelMetricResult(metric_name='accuracy', count=3, result=0.25)], '00000000-0000-0000-0000-000000000003': [ModelMetricResult(metric_name='accuracy', count=3, result=0.5)]}
我们获得了一个 dict,其中键包含给定注释者的 user_id 和包含请求指标的列表。对于这些指标的解释,我们在此假设预测对应于提供给注释者的建议,而真实标签对应于注释者给出的回复。这样,我们可以解释指标并查看模型是否按预期执行。指标是针对每个注释者单独计算的,因此我们可以看到哪些注释者给出的回复与模型一致,哪些不一致。
或者,我们有机会直接从数据集中计算指标。让我们使用以下数据集,并计算建议的指标
mmodel_metrics = dataset.compute_model_metrics(question_name="label", metric_names=["accuracy", "precision", "recall", "f1-score"])
suggestions_metrics['00000000-0000-0000-0000-000000000001']
# [ModelMetricResult(metric_name='accuracy', count=1269, result=0.43341213553979513),
#  ModelMetricResult(metric_name='precision', count=1269, result=0.5593881715337764),
#  ModelMetricResult(metric_name='recall', count=1269, result=0.6166023130799764),
#  ModelMetricResult(metric_name='f1-score', count=1269, result=0.5448304082545485)]
请记住,此数据集非常大,因此下载和计算指标可能都需要一些时间。您可以查看 dataset 以获取更多信息。
对于统一回复#
正如我们所见,ModelMetric 允许我们将模型建议与注释者的回复(我们选择作为基本事实)进行比较。计算是针对每个回复单独完成的,这使我们可以看到模型相对于每个注释者的性能。但是,在某些情况下,我们可能希望查看模型相对于注释者作为一个整体的性能,而不是单独查看。为此,我们可以使用 UnifiedModelMetric 类,该类允许我们计算统一回复的指标。为此,我们依赖于 统一分歧 中定义的统一策略。
import argilla as rg
from argilla.client.feedback.metrics import UnifiedModelMetric

feedback_dataset = rg.FeedbackDataset.from_argilla("...", workspace="...")
strategy_name = "majority"
unified_dataset = feedback_dataset.compute_unified_responses(question, strategy_name)
metric = UnifiedModelMetric(dataset=unified_dataset, question_name="question_name")
unified_metrics = metric.compute("accuracy")
# >>> unified_metrics
# ModelMetricResult(metric_name='accuracy', count=3, result=0.25)
我们获得了与指标结果相同的容器,但在这种情况下,它不与任何特定的注释者关联,而是与他们的一般一致性关联。
我们可以使用我们在上面看到的相同方法直接从 FeedbackDataset 中使用,但请注意此处使用的策略参数
model_metrics_unified = dataset.compute_model_metrics(question_name="label", metric_names=["accuracy", "precision", "recall", "f1-score"], strategy="majority")
model_metrics_unified
# [ModelMetricResult(metric_name='accuracy', count=53990, result=0.8048342285608446),
#  ModelMetricResult(metric_name='precision', count=53990, result=0.8085185809086417),
#  ModelMetricResult(metric_name='recall', count=53990, result=0.7679974812646655),
#  ModelMetricResult(metric_name='f1-score', count=53990, result=0.786466989240015)]
默认情况下,回复不会被统一,我们将获得注释者级别的回复,但是如果我们要求特定的策略(请参阅每种问题的可用策略),它们将被自动统一和计算。
支持的模型指标#
我们计划添加对其他指标的更多支持,因此请随时在我们的 Slack 或 GitHub 上联系我们,以帮助我们确定每个任务的优先级。
指标/问题类型 |
LabelQuestion |
MultiLabelQuestion |
RatingQuestion |
RankingQuestion |
TextQuestion |
|---|---|---|---|---|---|
准确率 |
✔️ |
✔️ |
✔️ |
||
精确率 |
✔️ |
✔️ |
✔️ |
||
召回率 |
✔️ |
✔️ |
✔️ |
||
f1-分数 |
✔️ |
✔️ |
✔️ |
||
混淆矩阵 |
✔️ |
✔️ |
✔️ |
||
皮尔逊相关系数 r |
✔️ |
||||
斯皮尔曼相关系数 r |
✔️ |
||||
GLEU |
✔️ |
||||
ROUGE |
✔️ |
||||
NDCG 分数 |
✔️ |
其他数据集#
注意
本节中介绍的记录类对应于三个数据集:DatasetForTextClassification、DatasetForTokenClassification 和 DatasetForText2Text。这些将在 Argilla 2.0 中弃用,并由完全可配置的 FeedbackDataset 类取代。不确定使用哪个数据集?请查看我们关于选择数据集的部分。
本指南简要介绍了 Argilla 指标。Argilla 指标使您能够对您的模型和训练数据集执行细粒度分析。Argilla 指标的灵感来自许多开创性工作,例如 Explainaboard。
主要目标是使构建更健壮的模型和训练数据变得更容易,超越单一数字指标(例如,F1)。
本指南简要概述了当前支持的指标。有关完整的 API 文档,请参阅 Python API 参考。
所有 Python 指标都在其中介绍
from argilla import metrics
注意
此功能是实验性的,您可以预期 Python API 会发生一些变化。请在 Github 上报告您遇到的任何问题。
注意
验证您是否已安装 Jupyter Widgets 以正确可视化绘图。请参阅 https://ipywidgets.readthedocs.io/en/latest/user_install.html
要运行本指南,您需要安装以下依赖项
%pip install datasets spacy plotly -qqq
以及 spacy 模型
!python -m spacy download en_core_web_sm -qqq
1. NER 预测指标#
加载数据集和模型#
我们将在本指南中使用 spaCy,但我们将看到的所有指标都是为任何其他框架(Flair、Stanza、Hugging Face 等)计算的。作为一个例子,我们将使用 WNUT17 NER 数据集。
import argilla as rg
import spacy
from datasets import load_dataset

nlp = spacy.load("en_core_web_sm")
dataset = load_dataset("wnut_17", split="train")
在 dataset 中记录记录#
让我们使用内置的 rg.monitor 方法记录 spaCy 预测
nlp = rg.monitor(nlp, dataset="spacy_sm_wnut17")

def predict(records):
    for _ in nlp.pipe([
        " ".join(record_tokens)
        for record_tokens in records["tokens"]
    ]):
        pass
    return {"predicted": [True]*len(records["tokens"])}

dataset.map(predict, batched=True, batch_size=512)
探索管道指标#
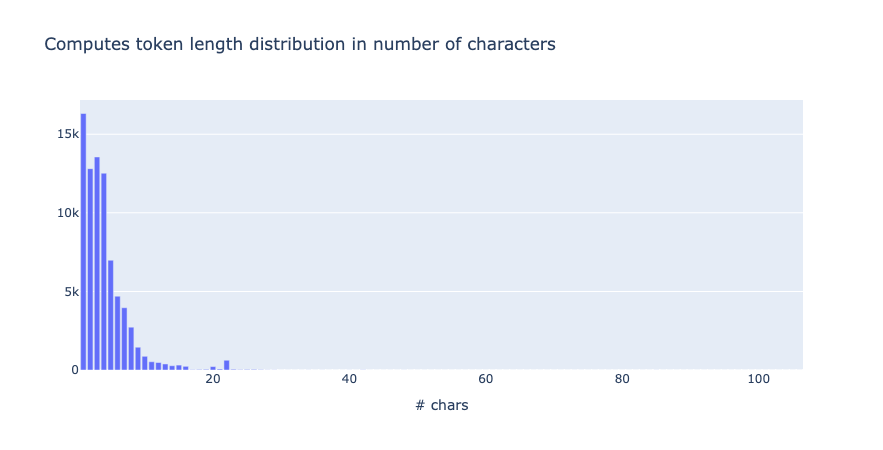
from argilla.metrics.token_classification import token_length

token_length(name="spacy_sm_wnut17").visualize()
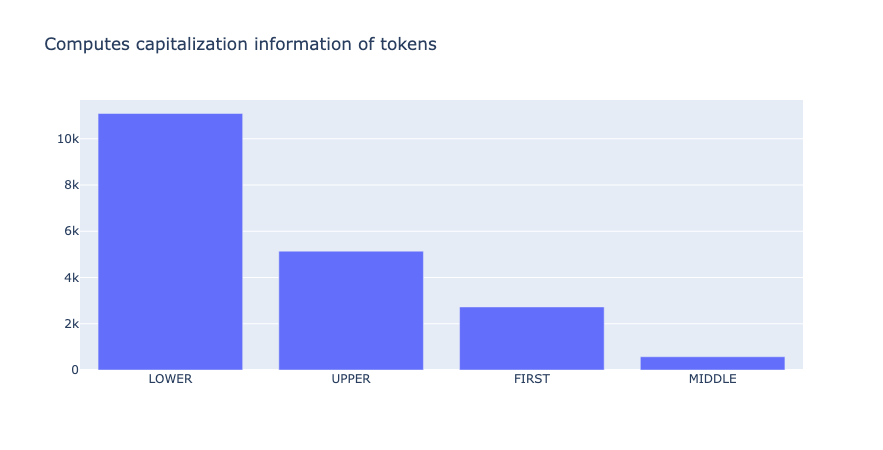
from argilla.metrics.token_classification import token_capitalness

token_capitalness(name="spacy_sm_wnut17").visualize()
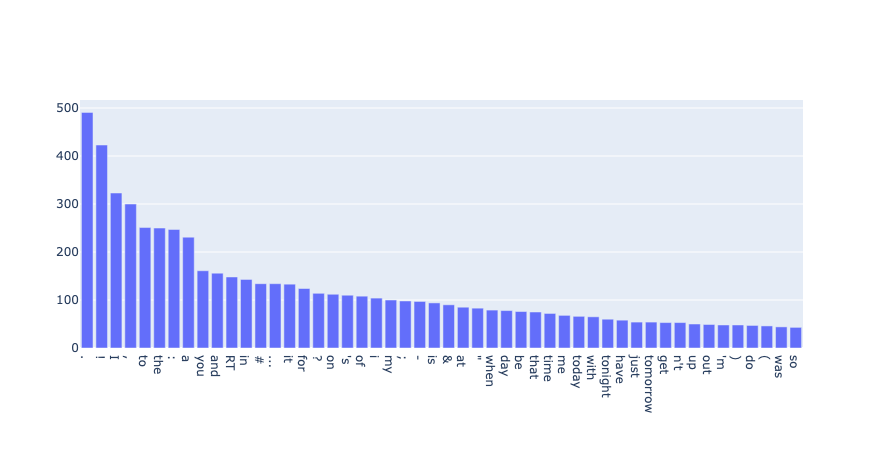
from argilla.metrics.token_classification import token_frequency

token_frequency(name="spacy_sm_wnut17", tokens=50).visualize()
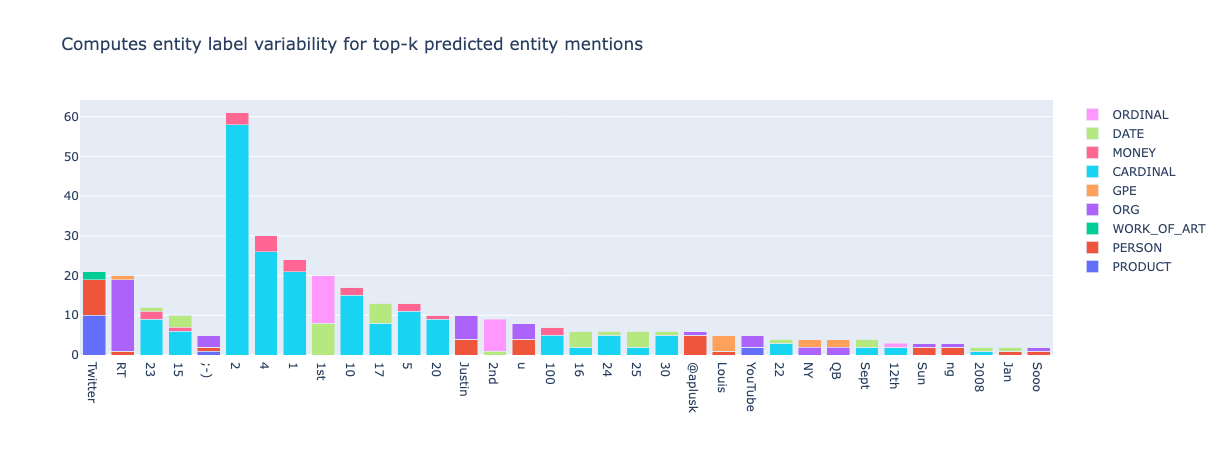
from argilla.metrics.token_classification.metrics import top_k_mentions

top_k_mentions(name="spacy_sm_wnut17", k=5000, threshold=2).visualize()
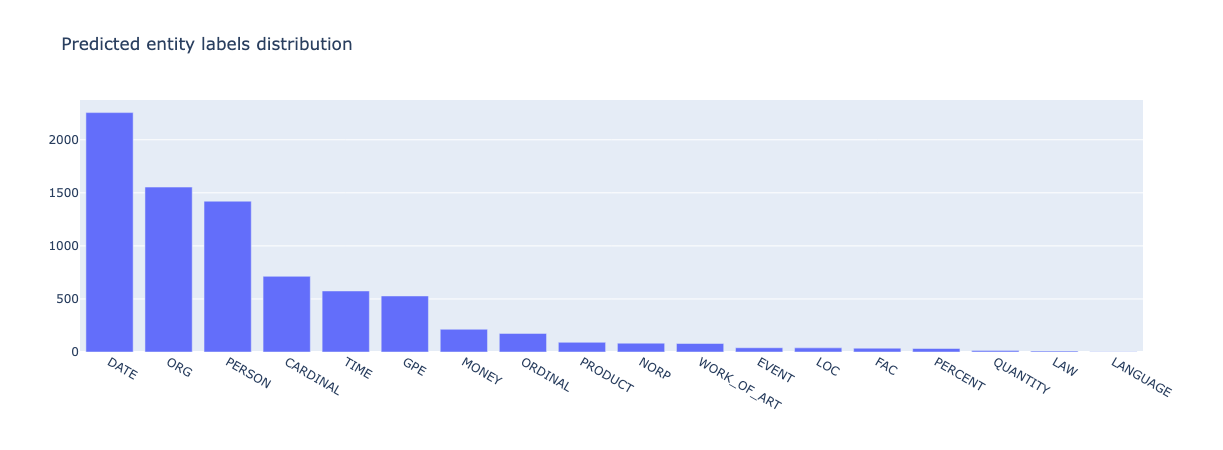
from argilla.metrics.token_classification import entity_labels

entity_labels(name="spacy_sm_wnut17").visualize()
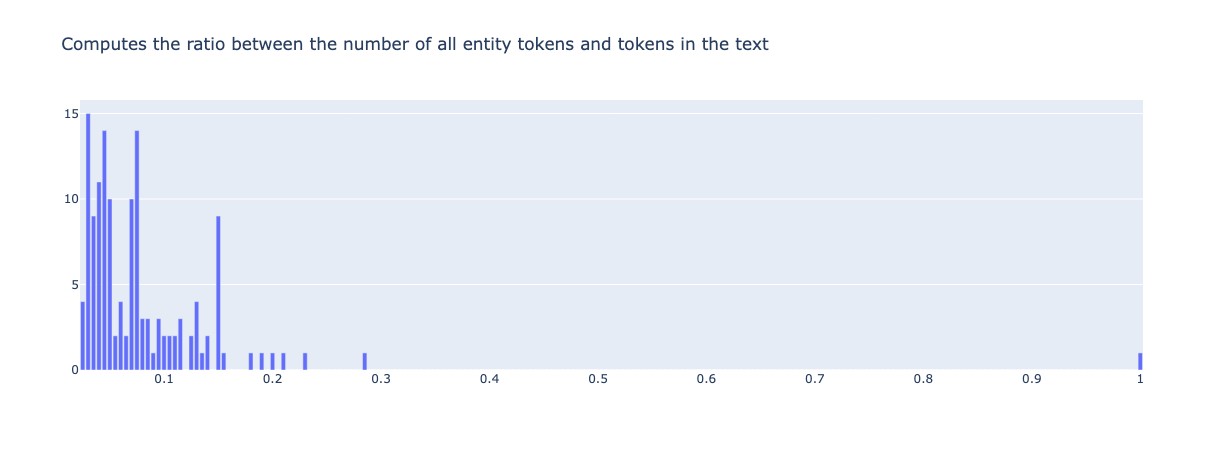
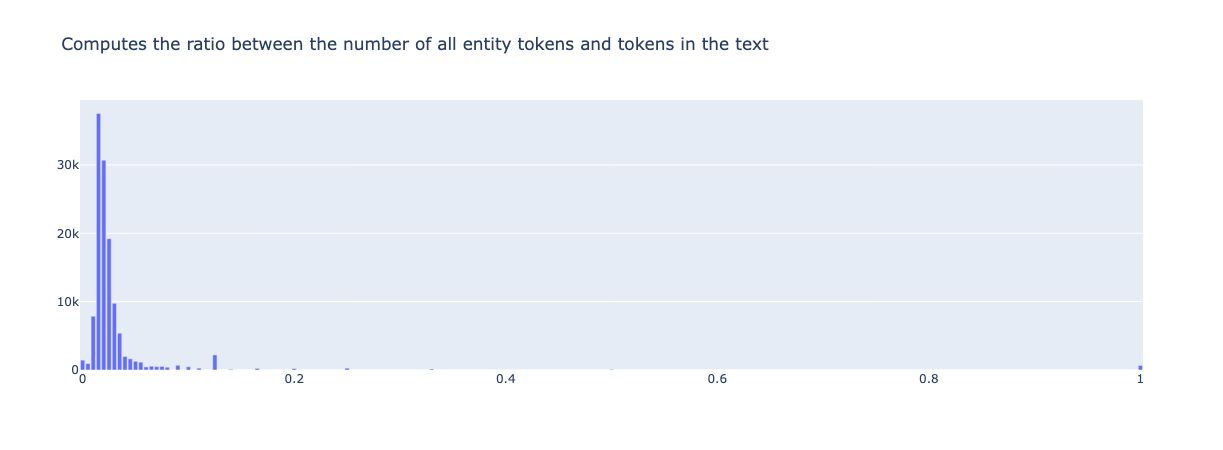
from argilla.metrics.token_classification import entity_density

entity_density(name="spacy_sm_wnut17").visualize()
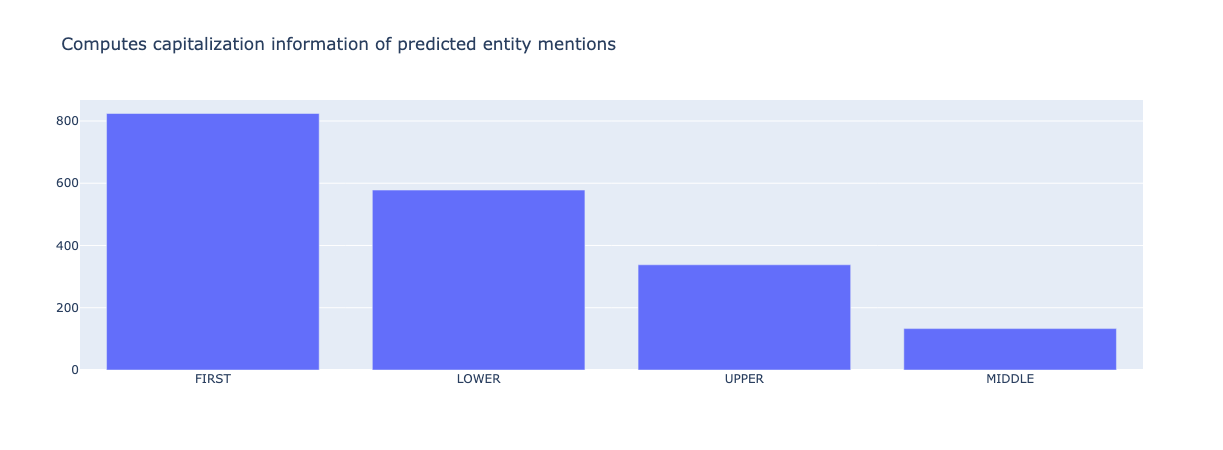
from argilla.metrics.token_classification import entity_capitalness

entity_capitalness(name="spacy_sm_wnut17").visualize()
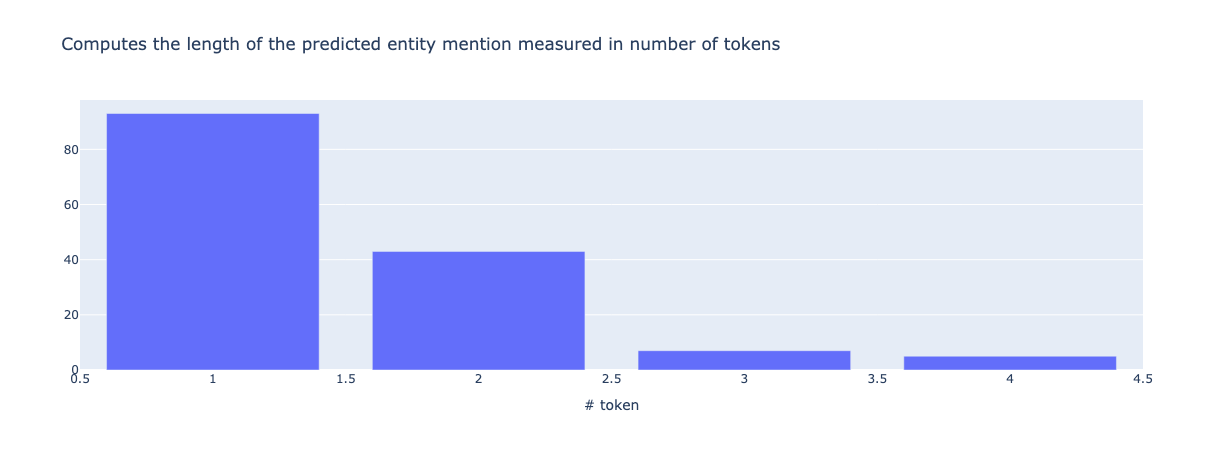
from argilla.metrics.token_classification import mention_length

mention_length(name="spacy_sm_wnut17").visualize()
2. NER 训练指标#
分析标签#
让我们在标签级别分析 conll2002 数据集。
dataset = load_dataset("conll2002", "es", split="train[0:5000]")
def parse_entities(record):
    entities = []
    counter = 0
    for i in range(len(record["ner_tags"])):
        entity = (
            dataset.features["ner_tags"].feature.names[record["ner_tags"][i]],
            counter,
            counter + len(record["tokens"][i]),
        )
        entities.append(entity)
        counter += len(record["tokens"][i]) + 1
    return entities
records = [
    rg.TokenClassificationRecord(
        text=" ".join(example["tokens"]),
        tokens=example["tokens"],
        annotation=parse_entities(example),
    )
    for example in dataset
]
rg.log(records, "conll2002_es")
from argilla.metrics.token_classification import top_k_mentions
from argilla.metrics.token_classification.metrics import Annotations

top_k_mentions(
    name="conll2002_es",
    k=30,
    threshold=4,
    compute_for=Annotations
).visualize()
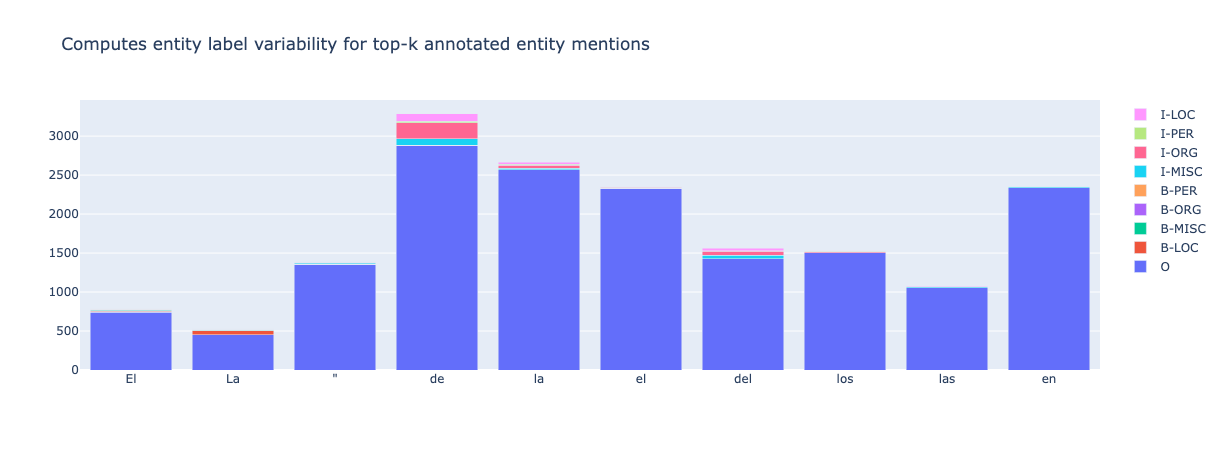
从上面我们可以看到,我们可以快速检测到注释问题:双引号 " 大多数时候被标记为 O(非实体),但在某些情况下(约 60 个示例)被标记为实体(如 ORG 或 MISC)的开头,这很可能是手动标记错误,包括实体范围内的引号。
from argilla.metrics.token_classification import *

entity_density(name="conll2002_es", compute_for=Annotations).visualize()
3. 文本分类指标#
from datasets import load_dataset
from transformers import pipeline

import argilla as rg

sst2 = load_dataset("glue", "sst2", split="validation")
labels = sst2.features["label"].names
nlp = pipeline("sentiment-analysis")
records = [
    rg.TextClassificationRecord(
        text=record["sentence"],
        annotation=labels[record["label"]],
        prediction=[
            (pred["label"].lower(), pred["score"]) for pred in nlp(record["sentence"])
        ],
    )
    for record in sst2
]
rg.log(records, name="sst2")
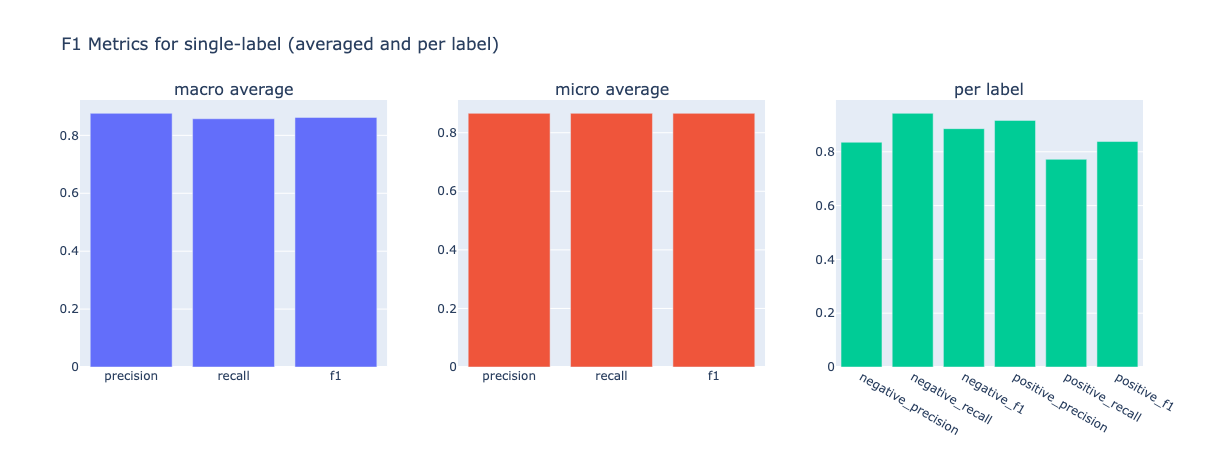
from argilla.metrics.text_classification import f1

f1(name="sst2").visualize()
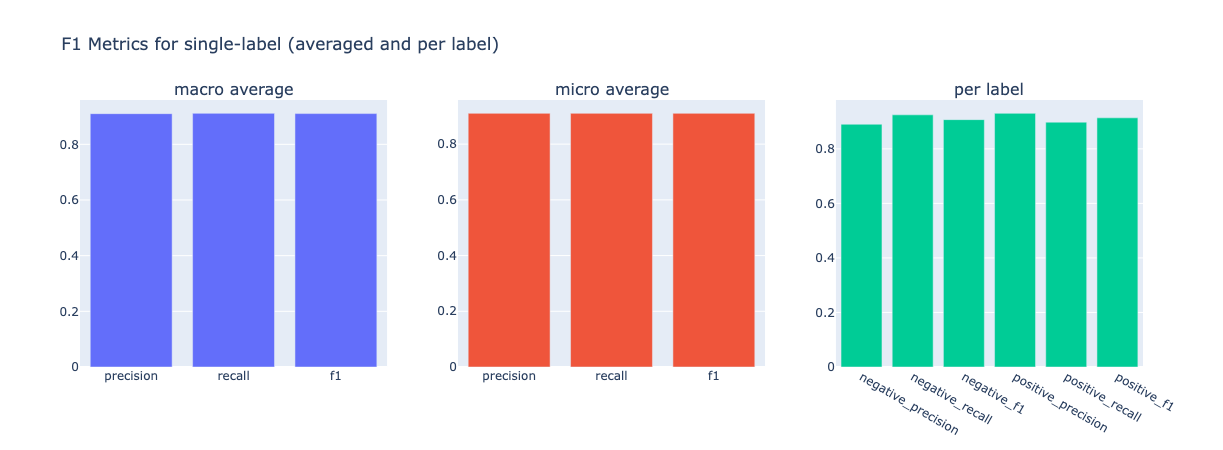
# now compute metrics for negation ( -> negative precision and positive recall go down)
f1(name="sst2", query="n't OR not").visualize()